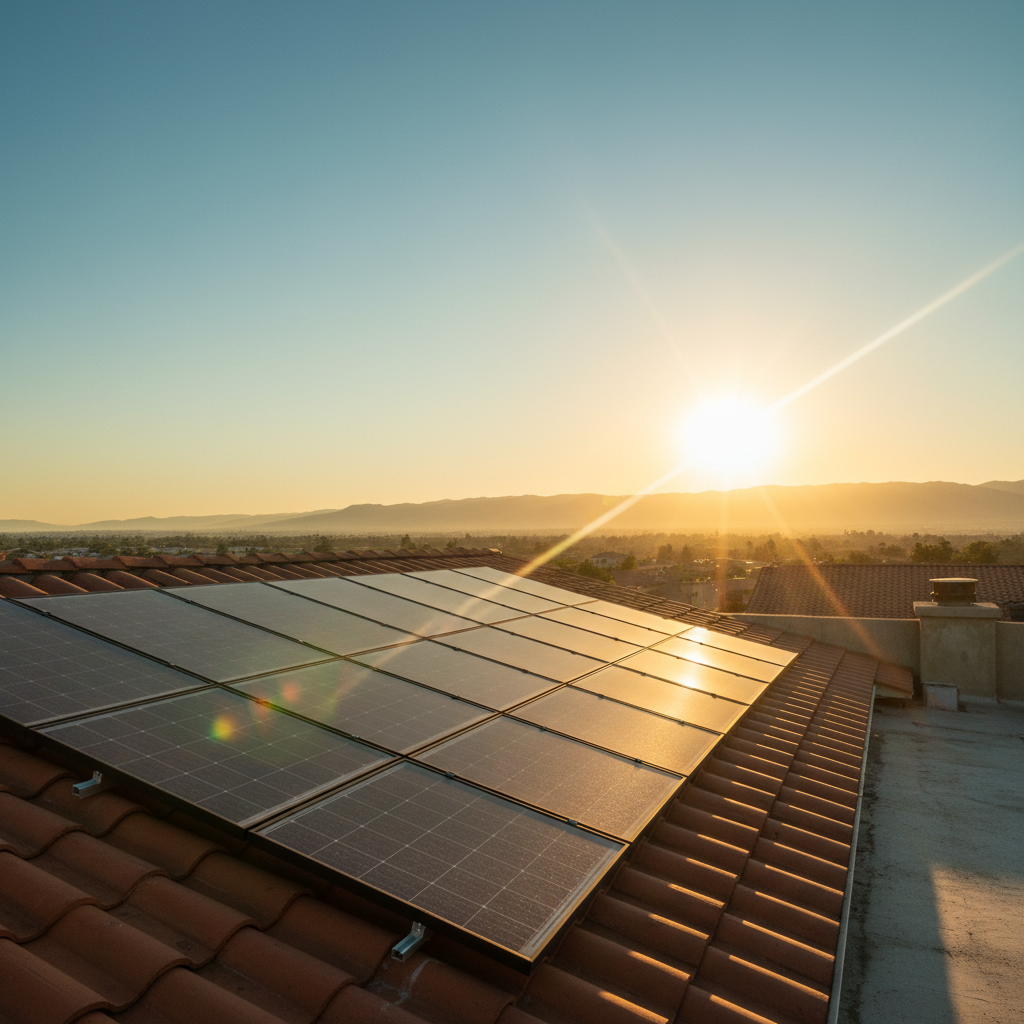
My 6.4kW rooftop system in the Pacific Northwest generated almost exactly what NREL PVWatts predicted in year one. Year two, it came in 7% short. Not catastrophic, but enough that I spent two weekends learning more about solar panel failure modes than I ever wanted to know.
That experience is this article. I’ve tracked my system’s output against utility bills monthly since 2022, cross-referenced production data with weather records, and dug into every common failure mode using thermal imaging, monitoring app data, and — in one case — an electroluminescence inspection that revealed three cracked cells invisible to the naked eye.
Most solar panel problems are diagnosable without an engineering degree. Several are completely invisible until they’ve been quietly costing you money for years. Here’s what I’ve learned about finding and fixing them.
Who this is for: anyone with an existing system who suspects underperformance, anyone planning to buy and wants to understand what can go wrong, and anyone deciding whether to repair or replace aging panels. If you’re still evaluating whether solar makes financial sense in 2026 at all, start with the full ROI breakdown first.
A note on incentives: if you installed before December 31, 2025 and claimed the federal 30% ITC, your system’s financial math is locked in. If you’re evaluating repairs or replacements in 2026, that credit is gone — it expired with the One Big Beautiful Bill. That changes the break-even math on repair versus replace decisions, and I address it directly in the ROI section.
Most Common Solar Panel Problems at a Glance
| Problem | Frequency | Detectability | Typical Fix Cost | Urgency |
|---|---|---|---|---|
| Soiling / Bird Droppings | Very High | Easy (visible) | $0–$150 | Low |
| Shading from New Obstructions | High | Moderate | $800–$3,500 | Medium |
| Microcracks | Moderate | Very Hard | $200–$600/panel | High |
| Hotspots | Moderate | Hard (thermal imaging needed) | $300–$800/panel | Very High |
| PID (Potential Induced Degradation) | Moderate | Hard | $1,500–$4,000 | High |
| Delamination | Lower | Moderate (visual) | Panel replacement | High |
| String Inverter Failure | Moderate | Easy (total outage) | $1,800–$3,500 | Critical |
| Wiring / Connector Degradation | Lower | Hard | $200–$900 | High |
Most urgent: Hotspots carry fire risk and require immediate attention. Most expensive over time if ignored: PID — it compounds silently until you’re seeing 20%+ production loss, frequently misdiagnosed as normal panel aging.
How I Evaluated These Problems
My primary reference is my own system’s monitoring data: 6.4kW of Qcells panels with Enphase IQ7+ microinverters installed in the Pacific Northwest in late 2022. I compare monthly production against PVWatts estimates for my specific address, azimuth, and 18° tilt.
When I noticed the 7% underperformance in year two, I had a thermal imaging inspection done at $225. That inspection identified two developing hotspots and one cold panel with a failing microinverter — all within warranty, all covered, none visible to naked-eye inspection.
For this article, I also drew on Clean Energy Reviews’ failure rate database, Enphase’s published 0.05% annual failure rate figures, the August 2025 class-action investigation alleging elevated IQ8 failure rates on high-wattage pairings, and r/solar community data where homeowners regularly share monitoring screenshots and inspection results. All pricing is cross-referenced against 2026 installer quotes and current industry benchmarks.
Problem 1: Soiling, Dust, and Bird Droppings
Best for understanding: every homeowner with panels, especially in dry or agricultural climates.
What happens: A uniform dust layer cuts output 1–5%. A single bird dropping concentrated on one cell of a string inverter system can drag down the entire string — potentially 5–25% production loss from a smear the size of your thumb.
This distinction matters enormously. On a string inverter system, partial soiling of even one panel degrades every panel in that string. On an Enphase microinverter or SolarEdge optimizer setup, one dirty panel affects only itself. Soiling is a nuisance on a microinverter system; it can be a production crisis on a string system with no shade management.
Also worth knowing: birds nesting under panels create far worse sustained soiling than random perching. Critter guards and pigeon netting are genuine maintenance considerations — not just afterthoughts — especially on lower-pitch roofs.
How to detect it: Compare actual production to PVWatts predictions. Running 3–8% below expected with panels you haven’t cleaned in over a year? Start there before any expensive diagnostics.
How to fix it: In climates with regular rainfall, panels tilted above 15° are effectively self-cleaning. The Pacific Northwest’s rain handles my system without intervention. In dry, dusty climates — Arizona, Nevada, inland California — manual cleaning once or twice yearly makes economic sense.
Use distilled or deionized water and a soft-bristle brush. Check price on Amazon for a dedicated solar panel cleaning kit. Hard water leaves mineral deposits that are often worse than the original dirt. Never use abrasive cleaners or high-pressure washers — they can crack panel glass and void warranties.
Pros of cleaning regularly:
- Recovers 3–5% production in dusty climates at minimal cost
- Lets you visually inspect for delamination, cracks, or bird damage
- Removes corrosive bird dropping residue before it etches glass
- Keeps panel-level monitoring readings meaningful as a diagnostic baseline
Cons / caveats:
- Climbing on roofs carries fall risk — hire a service if you’re uncomfortable
- Hard water cleaning is worse than no cleaning at all
- In rain-rich climates, cleaning rarely improves economics enough to justify the effort
Problem 2: Microcracks — The Invisible Performance Killer
Best for understanding: owners of panels older than 5 years, anyone who had hail or heavy wind loading, and anyone considering used panels.
What happens: Microcracks are fractures in the silicon cells — typically 0.1–5mm long and completely invisible to the naked eye. According to Clean Energy Reviews’ failure research, microcracks that don’t cause full electrical separation reduce efficiency by approximately 2.5%. When they progress to full cell inactivation, they create hotspots, which is where the real danger starts.
Causes: Thermal cycling (hot days, cold nights), hail impact, wind loading, installation mistakes (stepping on panels or dropping tools during install), and manufacturing defects. Transport vibration from the factory to the job site is also a documented cause.
N-type panels — TOPCon, HJT, and HPBC cell technology — show measurably lower microcrack propagation under thermal cycling compared to older P-type PERC panels. This is one quantifiable reason the Maxeon 7 and REC Alpha Pure-R command their price premium. On a 25-year horizon, that difference in structural resilience compounds into meaningful kWh.
How to detect it: Electroluminescence (EL) imaging is the only reliable method. An EL camera passes current through the panel and photographs the infrared emission — cracked cells appear dark against the healthy glow of functioning cells. EL inspections cost $150–$400 depending on system size and inspector availability in your area.
You cannot see microcracks in visible light. If your monitoring shows one panel consistently underperforming neighbors by 3–5%, request EL imaging before assuming inverter failure.
How to fix it: Microcracks cannot be repaired. Replace the panel, or accept the efficiency loss if it’s minor, stable, and not creating hotspot risk. Check your product warranty — most manufacturers offer 10–12 year product warranties covering manufacturing defects. The challenge: proving a microcrack is a manufacturing defect versus installation damage requires pre- and post-installation documentation. Photograph your panels on the day of installation.
Pros of early detection:
- Catch within-warranty period and get panel replaced at no cost
- Prevent progression to hotspot and fire risk
- Restore full system output before losses compound
Cons / caveats:
- EL inspection is not a DIY procedure — requires specialized equipment
- Inspector availability varies significantly by region
- Warranty claims require manufacturer acceptance, which isn’t guaranteed
Problem 3: Hotspots — Urgency Level: Immediate
Best for understanding: any homeowner with a system over 5 years old, in dusty regions, or where trees have grown since installation.
What happens: A hotspot is localized overheating in a single cell, caused by partial shading, a cracked cell, or a bypass diode failure. The affected cell becomes reverse-biased and dissipates power as heat instead of generating electricity.
Temperatures in active hotspots can reach 150–200°C — hot enough to crack panel glass, melt the backsheet, and in severe cases, ignite a fire. This is not a monitor-and-revisit situation.
Hotspots are the endpoint that microcracks and soiling problems lead to when left unaddressed. A bird dropping on one cell in a shaded string inverter system can cause a hotspot. A microcrack that causes partial cell inactivation creates current mismatch that causes a hotspot. The root causes are varied; the urgency is constant.
How to detect it: Thermal imaging. An infrared camera reveals hotspots as bright, localized warm patches against the cooler panel surface. A handheld FLIR thermal camera Check price on Amazon makes this DIY-accessible if you’re comfortable on a roof. Hiring an inspector runs $150–$300 for a full thermal scan. The $225 inspection that flagged my two developing hotspots likely prevented a significantly more expensive problem.
Modern microinverters also provide indirect early warning. A panel consistently producing near zero during clear, sunny conditions is a flag. String inverter systems provide zero panel-level data — which is exactly why the Enphase vs. SolarEdge monitoring comparison matters for catching these problems before they worsen.
How to fix it:
- Soiling-caused hotspot: clean the panel, retest, confirm resolution
- Microcrack-caused: panel replacement required
- Bypass diode failure: a qualified electrician can often replace bypass diodes without replacing the full panel — $150–$350 in labor
Check your installer’s workmanship warranty (typically 5–10 years on labor). Hotspots tied to an installation defect may be fully covered.
Pros of thermal imaging as a practice:
- Catches hotspots before they escalate to fire risk
- Also reveals delamination, cold panels, wiring issues in one pass
- Provides documentation for warranty claims
- $150–$300 inspection cost is dwarfed by potential damage costs
Cons / caveats:
- Must be performed during full-sun production hours for accurate readings
- Root cause identification still requires follow-on diagnostics (EL for microcracks, monitoring data for inverter issues)
- Thermal imaging inspectors are not universal — check NABCEP certifications
Problem 4: PID — Potential Induced Degradation
The most expensive problem over time. Frequently misdiagnosed as normal panel aging.
What happens: PID occurs when sustained high voltage differentials between the cell and the grounded aluminum frame drive ion migration through the EVA encapsulant. The result is a gradual, accelerating loss of output — verified field cases document 20%+ power loss in P-type PERC panels after 5–10 years of exposure in humid, high-temperature environments.
PID is most common in systems where the panels are positively grounded, operating voltages are high, temperatures and humidity are elevated, and encapsulant quality is below premium. Florida, the Gulf Coast, and tropical climates see the highest incidence rates.
The 2026 advantage of N-type panels: N-type cell technology — TOPCon, HJT, and HPBC — has significantly lower PID susceptibility than P-type PERC. This is a documented, quantifiable technical advantage. If you’re selecting new panels and live in a humid climate, N-type options like the LONGi Hi-MO X10 (24.3% efficiency, HPBC 2.0 cell technology) or the REC Alpha Pure-R2 (22.3% efficiency, HJT cell architecture with a documented low temperature coefficient) carry a real long-term edge over comparable P-type alternatives. See the full panel efficiency rankings for the complete comparison.
How to detect it: PID frequently gets misdiagnosed as normal aging. The red flag is annual production declining faster than the warranted degradation rate (typically 0.5%/year). If your system is losing 1.5–2% annually in years 5–10, that’s not the degradation curve working as designed. EL imaging confirms PID — affected cells show characteristic darkening at cell edges, distinct from microcrack patterns.
How to fix it:
- PID recovery devices: inject a counter-voltage during nighttime to reverse the ion migration. Cost: $200–$600 depending on system size. Studies show 50–90% output recovery in early-stage cases. Not a standalone fix — address root cause too.
- Grounding adjustment: a qualified installer can modify grounding configuration to reduce the driving voltage differential.
- Panel replacement: for severe or long-running PID (more than 5–6 years of progression), recovery devices rarely restore full output and panel replacement becomes the only realistic path.
Pros of PID awareness:
- Early-stage PID is recoverable — intervention within years 3–5 saves thousands
- Choosing N-type panels at install time eliminates PID as a risk category
- Some states’ solar warranty programs specifically cover PID remediation costs
Cons / caveats:
- PID recovery devices require installation during panel downtime and add ongoing maintenance
- Proving PID is the cause (not general degradation) requires documentation
- Most budget-tier manufacturers’ warranty language around PID is deliberately vague — read it carefully
Problem 5: Delamination
Best for understanding: owners of systems in hot/humid climates, anyone with semi-flexible panels, and buyers evaluating used solar systems.
What happens: Delamination is the separation of the encapsulant layers that bond the glass, silicon cells, and backsheet into a weatherproof sandwich. Once those layers separate, moisture infiltrates — corroding cell contacts and bus bars and accelerating output decline. Visual indicators include bubbling, browning, or yellowing visible between the glass and the cell layer.
Causes: UV degradation of the EVA encapsulant over time, manufacturing defects in the lamination process, or extreme thermal cycling that fatigues the adhesive bonds. Semi-flexible panels and lower-cost Chinese-manufactured modules show significantly higher delamination rates than premium-tier products.
How to detect it: Visual inspection is your first pass — look for visible bubbling, discoloration, or areas where the panel layers appear separated. Thermal imaging during peak production hours may reveal hot patches in delaminated zones. Delamination often progresses from panel edges inward.
How to fix it: There is no repair for delamination. A delaminated panel must be replaced. Additionally, most manufacturer warranties explicitly exclude coverage if delamination resulted from improper installation, physical impact, or unauthorized modifications — document your system’s condition thoroughly and photograph panels on installation day.
If you’re purchasing new panels, encapsulant quality is exactly where budget manufacturers cut invisible corners. Maxeon offers a 40-year product warranty — the longest in the residential solar industry by a wide margin — which reflects genuine manufacturing confidence in encapsulant longevity that shorter-warranty competitors cannot match. The specific degradation guarantee over that 40-year term varies by panel model, so verify the exact warranted output floor for the model you’re quoted. The Maxeon vs. REC comparison breaks down the warranty differences in detail.
Problem 6: Inverter Failures
The most impactful single-point failure for string-configured systems.
String inverter failure: When a string inverter dies, the entire system goes dark. Published field data puts string inverter annual failure rates at 0.89% — meaning roughly 1 in 112 string inverters fails in any given year. With a standard 10–12 year product warranty (SolarEdge’s base warranty is 12 years) and a 25-year system life, plan on at least one mid-life replacement.
Replacement cost: $1,800–$3,500 for parts and labor on a residential string inverter. SolarEdge’s warranty extension to 20 or 25 years costs $150–$350 extra at contract signing. Given that a mid-life replacement runs $1,800–$3,500, extending at signing is straightforward math.
One flag I’d raise about SolarEdge in 2026: the company went through significant financial restructuring through 2024–2025. Multiple installers have flagged warranty support viability as a genuine long-term concern. I’m not predicting SolarEdge’s failure, but when you’re making a 25-year financial decision, the counterparty’s survival matters. The full inverter analysis covers this in depth.
Microinverter failure (Enphase IQ8): Enphase’s published annual failure rate is 0.05% — versus 0.89% for string inverters, a roughly 18x difference. When an IQ8 fails, only that one panel goes offline. The Enphase Enlighten app shows you the affected panel immediately; the rest of the system continues generating normally.
On the August 2025 class-action: Migliaccio & Rathod LLP opened an investigation alleging 10–20% premature failure rates within the first two years on systems using 400W+ panels, citing over-current stress not disclosed in product documentation. These figures come from a plaintiff law firm, not independent testing — treat them as alleged, not confirmed. Enphase disputes the claims. I’d treat this as a reason to ask your installer about IQ8 variant pairing specs for high-wattage panels, not as a reason to avoid microinverters entirely.
Enphase IQ8 replacement hardware: $130–$200 per unit, plus $150–$250 in labor for roof access. Every IQ8 unit carries a 25-year product warranty — the longest in the residential inverter category and one of the few that actually matches panel warranty length.
How to detect inverter issues: Both Enphase Enlighten and SolarEdge mySolarEdge alert you to underperforming or offline panels. If your system has no panel-level monitoring, your only signal is an electricity bill that stops improving. Compare monthly production against PVWatts for your address to establish whether the numbers make sense.
Problem 7: Shading — The Wrong Inverter Choice Costs You Every Day
Best for understanding: anyone with trees, chimneys, dormers, HVAC units, or any roof obstruction.
What happens: Partial shading from trees, chimneys, dormers, and rooftop HVAC equipment causes dramatic production loss in string inverter configurations. Because series-wired panels operate at the current of the weakest module, even minor shading on a single panel forces every panel in that string down to its reduced current output — field reports from homeowners with before/after monitoring data consistently show losses well beyond the shaded area’s proportion of total panel surface.
This is the problem that gets installed in at installation time and costs you money every single day for 25 years.
Retrofitting after the fact:
- Adding Tigo or SolarEdge power optimizers to an existing string inverter: $800–$2,000
- Converting to AC-coupled Enphase microinverters on an existing string system: $3,000–$5,000
In most scenarios, retrofit costs don’t fully recover against production gains unless shading is severe. The far better approach is demanding a formal shading analysis before signing any installation contract. Installers using Aurora, PVSketch, or Suneye can quantify shade impact precisely on your actual roof. Any proposal that estimates annual production without a formal shading analysis is guessing.
One nuance worth knowing: if your utility runs a time-of-use (TOU) rate structure with peak rates in the late afternoon (common in California, Nevada, and increasingly elsewhere), west-facing panels may generate more financial value than south-facing despite lower total annual kWh — because they produce more electricity during your most expensive rate hours. South-facing maximizes kWh; west-facing can maximize dollars. Check your utility’s rate schedule before finalizing panel placement.
For systems with persistent shading problems, the best solar panels with built-in optimizers compares the top MLPE (module-level power electronics) options.
Problem 8: Wiring and Connector Degradation
Slower and less dramatic than other problems — but a real fire risk when ignored.
What happens: MC4 connectors are the industry-standard solar cable connectors, rated for 25+ years when installed correctly. Mismatched connector brands from different manufacturers, insufficient insertion depth, or inadequate environmental sealing create resistance at the connection point. Resistance generates heat. Heat over time degrades the connector further and, in severe cases, creates an ignition risk.
Signs to look for: hot spots at junction boxes or cable runs visible during thermal imaging; one panel consistently underperforming by a stable, non-worsening margin (distinguishes from progressive problems like PID or microcracks); visible corrosion or discoloration at accessible connectors; burning smell during peak production hours (urgent).
How to check it yourself: A multimeter Check price on Amazon lets you check open-circuit voltage (Voc) at panel-level access points. A functioning 400W panel at standard test conditions (STC) should read approximately 37–41V open-circuit, depending on the specific model. Significant deviation from the spec sheet Voc indicates a high-resistance connection or dead panel.
Connector repair and wiring inspection require a licensed electrician comfortable with DC high-voltage systems — not all are. Budget $200–$500 for a wiring inspection and connector replacement.
Diagnostic Tools Comparison
| Tool | What It Finds | DIY Friendly | Cost | When to Use |
|---|---|---|---|---|
| Monitoring App (Enphase / SolarEdge) | Inverter failures, production trends | Yes | Free | Daily, ongoing |
| FLIR Thermal Camera | Hotspots, delamination | Yes (roof access required) | $250–$500 purchase, or hire at $150–$300 | When output dips unexpectedly |
| Electroluminescence (EL) Imaging | Microcracks, PID | No — hire inspector | $150–$400 | 5+ year systems, after physical impact |
| Multimeter / Clamp Meter | Connector resistance, open-circuit voltage | Yes | $30–$80 | Per-panel checks, wiring investigation |
| PVWatts Comparison (NREL) | General underperformance baseline | Yes | Free | Monthly |
| Full Professional Solar Audit | All of the above, documented report | No | $300–$600 | Systems over 7 years old, before home sale |
Buying Advice: Prevention Starts at Installation
Choose N-type cell technology: TOPCon, HJT, and HPBC panels have documented lower PID susceptibility, better microcrack resistance under thermal cycling, and lower degradation rates. N-type panels consistently show lower annual degradation than P-type PERC in independent field testing — the exact margin varies by manufacturer and climate, but across a 20–25 year system life, even a 0.1–0.2%/year degradation advantage compounds into thousands of additional kWh that you either generate or don’t. See what today’s best panels actually cost per watt.
Match inverter choice to your roof’s shade reality: if you have any shading — trees, chimneys, dormers, HVAC units — a string inverter without optimizers will cost you production every day for 25 years. Enphase IQ8 microinverters or SolarEdge HD-Wave with power optimizers are worth the $800–$1,200 premium. The panel-level monitoring alone catches problems that string monitoring misses entirely. See the full solar installation cost breakdown to understand how inverter choice affects total $/W.
Extend inverter warranties at contract signing: SolarEdge’s 20- or 25-year extension costs $150–$350. Mid-life string inverter replacement runs $1,800–$3,500. Do the math once and extend.
Assess roof condition before any panel discussion: a roof with fewer than 10 years remaining should be replaced before solar installation. Panel removal and reinstallation for a subsequent roof replacement adds $3,500–$6,000 to the roofing job — money that could have been avoided by sequencing correctly. An installer who skips this conversation is cutting a corner.
Establish monitoring from day one: whether you use Enphase Enlighten, SolarEdge mySolarEdge, or a standalone energy monitor, establish a production baseline within the first 30 days of operation. A warranty claim in year 4 with year-1 comparison data is vastly more actionable than a claim in year 8 with nothing to compare against.
Verify NABCEP certification and installer stability: post-SunPower, Sunnova, and Titan Solar Power bankruptcies in 2024–2025, thousands of homeowners lost workmanship warranty coverage when their installers closed. NABCEP certification signals professional standards; SolarReviews.com actively surfaces bad actors. Get competitive quotes via EnergySage — their marketplace data indicates homeowners who compare 3+ quotes typically save significantly versus accepting the first offer, though actual savings depend on your market and system size.
What We Rejected: Approaches That Don’t Work
DIY panel replacement without DC safety training: residential solar strings operate at 300–600V DC. DC arc flash is significantly more dangerous than AC at equivalent voltage — DC arcs don’t self-extinguish at zero-crossing. Don’t attempt panel replacement or high-voltage connector work without proper training and equipment, regardless of what YouTube tutorials suggest.
PID recovery devices as a substitute for root cause investigation: recovery devices can restore early-stage PID output, but if the underlying grounding configuration isn’t corrected, PID recurs. A recovery device without a system audit is symptom management, not a fix.
Using installer production estimates as your performance baseline: installer production estimates are often optimistic and generated before your specific roof’s micro-shading or orientation variations are fully understood. Use NREL PVWatts (free, address-specific) as your independent baseline. If your installer’s projected annual kWh is a round number that doesn’t closely match a PVWatts calculation for your specific address, tilt, and azimuth, treat it as a marketing estimate until proven otherwise.
Pricing and ROI: The Cost of Ignoring Panel Problems
Let me run the math on proactive maintenance versus reactive repair.
Scenario: 8kW system, $20,640 installed at the 2026 national average of $2.58/W. No federal ITC in 2026. Utility rate $0.15/kWh. State incentives reduce net cost by 20% to ~$16,512.
Expected annual production: ~9,600 kWh (at 1.2 kWh per rated-W per year — a reasonable mid-range estimate for markets like the mid-Atlantic or Midwest; adjust downward to ~1.0–1.1 for the Pacific Northwest and upward to ~1.5–1.8 for the Desert Southwest) Annual savings at $0.15/kWh: ~$1,440/year Simple payback period: ~11.5 years (with 20% state incentives applied)
If PID goes undetected for 8 years on a string-monitored system (no panel-level visibility):
- Year 8 output running 18–22% below nameplate: 7,680–7,900 kWh/year
- Annual savings drop to ~$1,152–$1,185/year
- Cumulative lost production value over 8 years: ~$2,000–$2,300
- Remediation cost (recovery device or panel replacement): $1,500–$4,000
- Total financial impact of non-detection: $3,500–$6,300
Preventive diagnostic cost:
- Thermal imaging inspection at year 5: $225
- EL imaging for microcrack/PID confirmation at year 5: $300
- Total preventive cost: $525
$525 in proactive diagnostics versus $3,500–$6,300 in undetected losses is the fundamental argument for maintenance.
In California under NEM 3.0, the stakes are higher. Export credits have dropped to $0.02–$0.08/kWh (down from ~$0.30/kWh under NEM 2.0), which means every kWh your panels fail to generate is a kWh you’re buying back at retail rates — not a kWh you can offset at high export credit. Panel health maintenance is now more financially significant in net-billing states than it was two years ago. See our complete net metering by state breakdown for the current policy picture.
If you’re adding battery storage to maximize self-consumption under net billing structures, the Powerwall 3 vs. Enphase IQ Battery 5P comparison covers the full economics. And if you’re considering whether a full battery system makes sense for your budget, the 7 best home battery systems guide is worth reviewing first.
Verdict
The single biggest factor in avoiding expensive solar panel problems is monitoring granularity at installation time. Systems with panel-level monitoring — Enphase Enlighten or SolarEdge’s panel-level monitoring — catch hotspots, inverter failures, and early-stage PID years before string-only systems would surface any signal. That time window is the difference between a warranty repair and an out-of-pocket panel replacement.
If you have an existing string inverter system with no panel-level monitoring, start by comparing monthly output against PVWatts for your address. If you’re more than 5% below expected and your system is over 5 years old, schedule a thermal imaging inspection before you spend money on anything else.
If you’re buying new in 2026 without the federal ITC, the cost math shifts — but the case for quality panels and panel-level monitoring strengthens, not weakens. Get multiple quotes via EnergySage — comparing 3+ quotes consistently yields significant savings according to EnergySage’s marketplace data — and confirm that panel-level monitoring is included in the contract, not positioned as an optional upsell.
Frequently Asked Questions
How do I know if my solar panels are underperforming?
Compare your actual monthly production in kWh to NREL’s PVWatts estimate for your specific address, roof tilt, and azimuth. Consistent underperformance of more than 5% warrants investigation. Your inverter’s monitoring app provides daily data, but you need PVWatts as an independent baseline — your installer’s production estimate was made at sale time and may not reflect your roof’s actual conditions. If you’re 5–15% below PVWatts consistently and weather hasn’t been unusual, start with a thermal imaging inspection.
Can I clean my solar panels myself, and does it actually help?
Yes, in most climates. Use distilled or deionized water and a soft-bristle brush — hard water leaves mineral deposits worse than the original dirt. In rain-rich climates like the Pacific Northwest, natural cleaning handles most of it. In Arizona, Nevada, or dusty agricultural areas, manual cleaning once or twice yearly can recover 3–5% of production. The economics are simple: one $100–$150 cleaning session versus the production loss from sustained soiling in dry climates.
What is a hotspot and how dangerous is it?
A hotspot is localized cell overheating — temperatures can reach 150–200°C — caused by partial shading, microcrack-induced current mismatch, or bypass diode failure. At those temperatures, you risk glass cracking, backsheet damage, and potential fire ignition. If your monitoring shows a panel producing near zero during clear, sunny conditions, or if you notice any visible surface damage or discoloration, get a thermal imaging inspection immediately. This is not a defer-and-monitor situation.
Does PID show up in standard inverter monitoring?
Not directly, and that’s the problem. PID causes gradual production decline that mimics normal degradation in string-level monitoring. The flag is production declining faster than the warranted degradation rate — typically 0.5%/year. If your system is losing 1.5–2% annually in years 5–10, that’s outside normal degradation territory. Panel-level monitoring (Enphase Enlighten, SolarEdge) helps by isolating which specific panels are underperforming, but EL imaging is required for confirmation.
What happens to my solar warranty if my installer goes out of business?
Panel manufacturer warranties and inverter warranties run directly with the manufacturer — if the brand still exists, those warranties remain intact regardless of installer status. What evaporates when an installer closes is the workmanship warranty on installation labor. After the SunPower Corporation bankruptcy in August 2024, the Sunnova Chapter 11 filing in June 2025, and the Titan Solar shutdown in mid-2024, thousands of homeowners discovered this gap firsthand. NABCEP certification, years in business, and SolarReviews.com ratings are partly a survivability screen — not just a quality signal.
Is PID covered under my panel warranty?
Most premium manufacturers — Maxeon, REC, Panasonic — explicitly warrant against PID-related power loss. Budget-tier manufacturers vary considerably; read the full warranty document, not the sales summary sheet. N-type cell technology (TOPCon, HJT, IBC) has documented lower PID susceptibility than P-type PERC, which is a real technical advantage in hot, humid climates. If you’re choosing between two otherwise similar panels, N-type’s PID resistance is a legitimate differentiator worth weighting.
How much does a professional solar inspection cost, and is it worth it?
A full professional inspection — visual assessment, thermal imaging, production data review, written report — typically runs $300–$600. Thermal imaging alone costs $150–$300. Electroluminescence imaging for microcrack and PID detection adds $150–$400. For any system over 7 years old, or ahead of a home sale (rooftop solar is an increasingly disclosed asset in real estate transactions), a documented clean inspection report is worth the cost. Treat it the way you’d treat an HVAC service call on a $20,000 system — standard scheduled maintenance, not an optional luxury.
Claire Dawson has tracked her 6.4kW Pacific Northwest rooftop system monthly since installation in late 2022. She writes about solar economics, financing structures, and the real financial math of residential energy decisions for SolarScout.