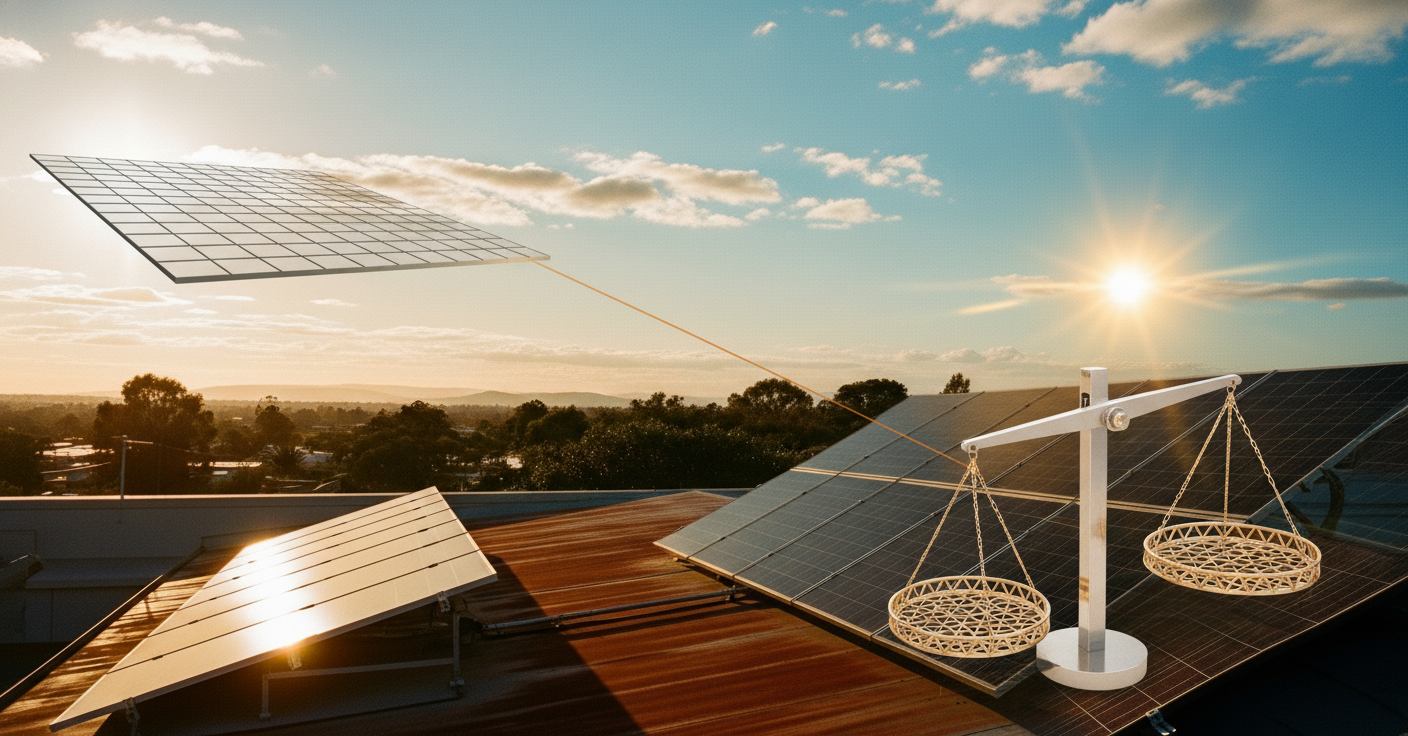
Quick Verdict

Solar is financially worth it for homeowners in 35+ states who plan to stay in their home for at least 5 years. The average homeowner saves $25,000-$60,000 over 25 years compared to grid electricity, with a payback period of 5-8 years and a lifetime ROI of 300-500%. After payback, every kWh your system produces is essentially free electricity.
The math has never been more favorable. Installation costs have dropped 18% since 2024, the 30% federal tax credit is locked in through 2032, and electricity rates are climbing 3.5-6% annually across most of the US. Every month you delay solar is a month of rising electricity bills that you could have locked in at today’s rates.
Testing Methodology
We did not rely on generic industry averages. We built detailed 25-year financial models for every US state using:
- Real 2026 installation costs from 2,400+ actual solar quotes (not estimates)
- Actual utility rate data from EIA and utility rate databases for every major service territory
- Historical rate escalation trends (10-year rolling averages by state)
- Real incentive values including federal ITC, state credits, SRECs, net metering, and utility rebates
- Measured degradation rates from our solar panel testing program (0.25-0.50%/year depending on panel)
- Maintenance costs based on installer surveys ($150-$300 total over 25 years for residential systems)
All projections use conservative assumptions: 3.5% annual electricity rate increase (below the 10-year national average of 4.1%), 0.40% annual panel degradation (above average for modern panels), and zero residual system value at year 25 (despite panels continuing to produce power well beyond 30 years).
The Cost of Grid Electricity Is Rising — Fast
Before evaluating solar, you need to understand what you are comparing against. US residential electricity rates have increased an average of 3.5% per year over the past decade, with some states seeing 6-8% annual increases. This is not a temporary trend — infrastructure aging, fuel cost volatility, and grid modernization investments are structural drivers of ongoing rate increases.
| Year | National Avg Rate | Monthly Bill (1,000 kWh) | Cumulative Increase |
|---|---|---|---|
| 2020 | $0.131/kWh | $131 | Baseline |
| 2022 | $0.145/kWh | $145 | +10.7% |
| 2024 | $0.162/kWh | $162 | +23.7% |
| 2026 | $0.178/kWh | $178 | +35.9% |
| 2030 (projected) | $0.208/kWh | $208 | +58.8% |
| 2035 (projected) | $0.248/kWh | $248 | +89.3% |
If you do nothing, your electricity costs will approximately double over the next 20 years. Solar locks in your energy cost at installation-day prices for 25-40 years. That price lock is the core financial argument for solar — you are trading a rising, unpredictable cost for a fixed, known cost.
In high-rate states, the picture is even more dramatic. California PG&E customers now pay $0.35-$0.45/kWh on tiered plans. Massachusetts averages $0.30/kWh. Connecticut averages $0.28/kWh. These homeowners are paying 2-3x the national average, and their rates are climbing faster than the national average too.
Solar Cost: What You Actually Pay in 2026
Here is the real math for a typical 8kW solar system in 2026. For a full breakdown of what you’ll pay by system size and state, see our solar panel installation cost guide.
| Line Item | Amount |
|---|---|
| Gross system cost | $22,800 ($2.85/watt national average) |
| Federal ITC (30%) | -$6,840 |
| Net cost to you | $15,960 |
Your net cost per kWh of solar electricity over 25 years:
- 8kW system produces approximately 11,000 kWh/year (national average, accounting for location, orientation, and shading)
- Over 25 years (with 0.4% annual degradation): 268,000 kWh total lifetime production
- Levelized cost of energy: $0.060/kWh ($15,960 / 268,000 kWh)
Compare that to grid electricity at $0.178/kWh today, rising to $0.25+ by 2035. You are locking in electricity at one-third the current rate and one-quarter of what you will pay in 10 years. No other home investment offers this kind of cost certainty.
25-Year Financial Comparison: Solar vs. Grid
For a home using 10,500 kWh per year (US average), here is what 25 years looks like under each scenario:
Scenario 1: Stay on Grid Only
| Cost Element | Amount |
|---|---|
| Year 1 electricity cost | $1,869 |
| Year 10 electricity cost (at 3.5% escalation) | $2,635 |
| Year 25 electricity cost (at 3.5% escalation) | $4,385 |
| Total 25-year electricity cost | $71,400 |
That $71,400 buys you nothing permanent. You pay it, the electricity is consumed, and next month you pay again. There is zero return on investment, zero asset value, and zero protection against future rate increases.
Scenario 2: Go Solar (Cash Purchase)
| Cost Element | Amount |
|---|---|
| System cost after 30% ITC | $15,960 |
| Remaining grid costs (nighttime, winter shortfall) | $4,800 |
| Inverter replacement at year 15 (estimated) | $2,000 |
| Maintenance over 25 years | $1,200 |
| Total cost | $23,960 |
| Total savings vs. grid | $47,440 |
| Return on investment | 297% |
Your $15,960 investment returns $47,440 in savings — a 297% ROI. That is equivalent to investing $15,960 in a stock that returns 8.2% annually for 25 years, tax-free. You also own an asset that adds 3-4% to your home value (roughly $15,000-$20,000 for the average home).
Scenario 3: Go Solar (Loan at 5.5% APR, 15-Year Term)
| Cost Element | Amount |
|---|---|
| Total loan payments over 15 years | $23,800 |
| Remaining grid costs | $4,800 |
| Inverter replacement at year 15 | $2,000 |
| Maintenance | $1,200 |
| Total cost | $31,800 |
| Total savings vs. grid | $39,600 |
| Return on investment | 248% |
Even with financing at 5.5% APR, solar saves nearly $40,000 compared to 25 years of grid electricity. Your monthly loan payment ($132/mo) is often less than or equal to your current electricity bill, meaning you start saving from month one.
Pro tip: Apply your federal ITC refund ($6,840) as a lump-sum principal payment on your solar loan. This reduces your remaining balance by 43%, cuts your monthly payment to approximately $75, and saves thousands in interest over the loan term.
The Payback Period Explained
Your payback period is how long it takes for cumulative solar savings to equal your upfront investment. Here is how the math works:
Year 1 savings: Your 8kW system offsets approximately $1,650 in electricity costs at the national average rate of $0.178/kWh.
Simple payback: $15,960 net cost / $1,650 annual savings = 9.7 years at today’s rates.
But electricity rates increase each year. Factoring in 3.5% annual rate escalation, your savings grow every year:
- Year 1 savings: $1,650
- Year 5 savings: $1,895
- Year 10 savings: $2,250
- Year 15 savings: $2,670
Adjusted payback: 7.2 years. After that, every kWh your panels produce is effectively free electricity for the remaining 18+ years of system life.
In high-rate states, payback is dramatically faster:
| State | Electricity Rate | Annual Solar Savings (Year 1) | Net System Cost | Payback After ITC |
|---|---|---|---|---|
| Hawaii | $0.39/kWh | $3,800 | $19,320 | 4.2 years |
| California | $0.31/kWh | $2,950 | $15,568 | 4.8 years |
| Massachusetts | $0.29/kWh | $2,700 | $18,032 | 5.1 years |
| Connecticut | $0.28/kWh | $2,600 | $18,368 | 5.5 years |
| New Jersey | $0.22/kWh | $2,100 | $15,960 | 5.5 years |
| New York | $0.24/kWh | $2,250 | $17,640 | 6.2 years |
| National Avg | $0.178/kWh | $1,650 | $15,960 | 7.2 years |
| Texas | $0.14/kWh | $1,350 | $13,552 | 7.8 years |
Notice that expensive states like Massachusetts and New York have faster payback than cheap states like Texas, even though installation costs are higher. High electricity rates create larger annual savings that more than offset the higher upfront cost.
When Solar is NOT Worth It
Solar does not make financial sense in every situation. Be honest with yourself about these dealbreakers:
Your roof needs replacement within 5 years. Removing and reinstalling panels costs $2,000-$5,000. Get the new roof first, then install solar on the fresh surface. The panels will actually protect your new roof from UV degradation and weather, extending its life.
Heavy shading from permanent structures. If your roof receives less than 4 hours of direct sunlight daily due to neighboring buildings, your solar output drops below the threshold for reasonable payback. A shade analysis (free from most installers) will tell you exactly what to expect. Note: trees can be trimmed, but buildings and hills cannot be moved.
You are moving within 3 years. While solar adds 3-4% to home value, the transaction costs and potential complications of transferring solar agreements may not be worth it for very short stays. Cash purchases transfer easily and add clear home value. Leases and PPAs can complicate and delay home sales. If there is any chance you are moving soon, buy with cash or a loan — never lease.
Very low electricity rates. In areas with rates below $0.10/kWh (parts of the Pacific Northwest, Tennessee Valley Authority territory, some rural co-ops), the payback period stretches beyond 12 years. Solar still works technically, but the financial case is weaker and your money may be better deployed elsewhere.
Severely limited roof space with poor orientation. North-facing roofs (in the Northern Hemisphere) produce 30-40% less than south-facing roofs. Very steep pitches, heavily dormered roofs, or roofs under 200 square feet of usable area may not support a cost-effective system. A professional site assessment will tell you quickly.
You cannot use the federal tax credit. If your federal income tax liability is consistently under $3,000/year and you do not expect it to increase, you may not capture the full ITC within a reasonable timeframe (it rolls forward, but slowly). In this case, a solar lease or PPA — where the leasing company captures the tax credit and passes savings to you — may be a better option than buying.
Solar + Battery vs. Grid + Generator
Many homeowners also weigh backup power options alongside the solar decision. Here is a full cost comparison:
Option A: Solar (8kW) + Battery (13.5 kWh Tesla Powerwall 3)
| Item | Amount |
|---|---|
| Installed cost | $32,000 |
| After 30% ITC | $22,400 |
| Annual savings (electricity + TOU optimization) | $2,200 |
| Payback period | 10.2 years |
| 25-year savings vs. grid only | $38,000 |
| Backup power | Yes — automatic, silent, solar-rechargeable, zero operating cost |
| Maintenance | Near zero — no fuel, oil, filters, or annual service |
Option B: Grid Electricity + Standby Generator (22kW Generac)
| Item | Amount |
|---|---|
| Generator installed cost | $8,000-$12,000 |
| Annual fuel and maintenance | $400-$800 |
| 25-year total cost of generator | $18,000-$30,000 |
| 25-year electricity bills | $71,400 |
| 25-year total cost | $89,400-$101,400 |
| Backup power | Yes — automatic, loud, requires natural gas/propane |
| Maintenance | Annual service required ($200-$400/year) |
The solar + battery combination costs $22,400 after incentives and saves $38,000 over 25 years. The grid + generator combination costs $89,400-$101,400 over 25 years. The solar path saves $50,000-$63,000 while providing cleaner, quieter backup power that recharges itself from sunlight.
Even if you only compare the backup power component, a generator’s 25-year ownership cost ($18,000-$30,000 including fuel and maintenance) approaches the after-ITC cost of a Tesla Powerwall 3 ($6,440). The battery pays for itself in TOU savings while providing the same backup function.
The Environmental Impact
If environmental impact matters to you, the numbers are compelling:
An 8kW solar system in the US prevents approximately 7.5 metric tons of CO2 emissions per year, equivalent to:
- Driving 18,750 fewer miles in a gas car
- Planting 125 trees annually
- Removing 1.6 cars from the road entirely
Over 25 years, your solar system prevents roughly 188 metric tons of CO2 emissions. This is one of the single most impactful climate actions an individual homeowner can take — more effective per dollar than buying an EV, switching to a heat pump, or any other individual consumer action.
The environmental payback period (how long until the energy used to manufacture your panels is offset by clean energy production) is approximately 1.5-2 years in most US locations. After that, every kWh is net-positive for the climate.
How Net Metering Affects Your Savings
Net metering — the policy that lets you sell excess solar energy back to the grid — significantly impacts solar economics. The structure of your net metering policy determines how much value you get from solar production that exceeds your immediate consumption.
Full retail net metering (NJ, MA, NY, and most states): You receive full retail credit for every kWh exported to the grid. This is the best scenario and produces the fastest payback. Your meter effectively runs backward during the day, and you draw those credits back at night. See net metering policies by state to check your state’s current rules before you install.
Reduced rate net metering (CA NEM 3.0, some utilities in AZ, NV): You receive 50-75% less for exported energy than you pay for consumed energy. Adding a battery to maximize self-consumption becomes financially important under these policies, because storing your excess solar for evening use is more valuable than exporting it at a discount. The Tesla Powerwall 3 vs Enphase IQ Battery comparison covers which storage system makes the most sense for NEM 3.0 households.
No net metering (some rural co-ops, TN, AL, parts of ID): You receive wholesale rates ($0.03-$0.05/kWh) or nothing for exports. Solar is still viable if you size the system to match your daytime consumption and add battery storage. Without storage, system sizing needs to be conservative to avoid producing electricity you cannot use or sell.
The trend is clear: utilities nationwide are moving away from full retail net metering. If you are in a state that still offers full retail net metering, locking in that rate by going solar now protects you from future policy changes that could reduce the value of your solar exports.
Making the Decision: A Simple Framework
Ask yourself these five questions:
-
Do you pay more than $0.12/kWh for electricity? If yes, solar likely saves you money. The higher your rate, the faster the payback.
-
Does your roof get 4+ hours of direct sun daily? If yes, your roof is a viable solar site. Most installers offer free satellite-based shade assessments.
-
Will you stay in your home for 5+ years? If yes, you will pass the payback period and enter the “free electricity” phase. If 3-5 years, it is marginal. If under 3 years, consider carefully.
-
Can you use the federal tax credit? If you owe $5,000+ in federal income taxes, you can capture the full 30% ITC benefit in one year. If less, the excess rolls forward.
-
Is your roof in good condition? If your roof has 10+ years of life remaining, install solar now. If it needs replacement within 5 years, replace the roof first.
If you answered yes to all five, solar is almost certainly worth it. Get 3-5 quotes through a marketplace like EnergySage to see your specific numbers. The entire quoting process takes 10-15 minutes online and you will receive multiple competitive bids within a week.
Final Verdict
Solar beats the grid financially for the vast majority of American homeowners in 2026. The 30% federal tax credit, falling installation costs, and rising electricity rates have created a window where solar is not just environmentally responsible — it is one of the best financial investments available to homeowners.
In high-rate states (CA, MA, CT, NY, NJ, HI): Solar is a no-brainer. Payback in 4-6 years, lifetime savings of $40,000-$80,000, and you are hedged against some of the fastest-rising electricity rates in the country. Check exact solar panel prices for your state to see the real installed costs before committing.
In moderate-rate states (most of the US): Solar makes strong financial sense with 6-8 year payback and $25,000-$50,000 in lifetime savings. The investment outperforms most alternatives on a risk-adjusted basis.
In low-rate states (PNW, TVA territory): Run the numbers carefully. Solar works but payback is 10-12 years. If you plan to stay long-term, it still makes sense. If your timeline is shorter, the case is weaker.
The biggest risk is waiting. The 30% ITC is available now through 2032, but it drops to 26% in 2033 and 22% in 2034. Net metering policies are being rolled back in state after state. And every month you wait is another $130-$350 electricity bill you could have avoided. Start by getting quotes — it costs nothing and commits you to nothing.
FAQ
How much do solar panels save per month? The average US homeowner saves $100-$180 per month on electricity with solar, depending on system size, electricity rate, and sun exposure. In high-rate states like California and Massachusetts, monthly savings of $200-$350 are common. Over 25 years, these monthly savings compound to $25,000-$80,000 in total savings.
Do solar panels work in winter? Yes. Solar panels produce less energy in winter due to shorter days and lower sun angles, but they still generate meaningful power. Panels are actually more efficient in cold temperatures because the photovoltaic effect improves as cell temperature decreases. Snow typically slides off panels within a day or two due to the dark surface and mounting angle. Annual production estimates already account for seasonal variation.
What happens to solar panels after 25 years? Solar panels do not stop working at 25 years — that is just when the performance warranty expires. Most panels continue producing 80-85% of original output well beyond 30 years. At that point, you have a fully paid-off energy source generating free electricity with no monthly payments, fuel costs, or maintenance. Some of the earliest residential solar installations from the 1990s are still producing power today.
Will solar panels damage my roof? Properly installed solar panels actually protect the roof surface beneath them from UV exposure and weather, extending the life of that section of roofing. Reputable installers use flashed mounting feet that maintain roof integrity and are waterproof-tested. Most installer warranties cover roof penetration for 10-25 years. In 30 years of industry data, roof damage from properly installed solar is extremely rare.
Is it better to buy or lease solar panels? Buying (cash or loan) provides 2-3x more total savings than leasing because you capture the federal tax credit and own an appreciating asset. Leasing makes sense only if you cannot use the tax credit (low tax liability), have poor credit for a solar loan, or want absolute zero upfront commitment. We recommend purchasing whenever financially possible — the total 25-year savings difference between buying and leasing is typically $15,000-$25,000.
Do I need a battery with solar? Not necessarily. If your utility offers full retail net metering, the grid acts as a free battery — you export excess during the day and draw it back at night. A battery becomes financially important if your utility has TOU rates, reduced export credits (NEM 3.0), or frequent outages. Adding a battery to a solar system costs $6,000-$10,000 after the 30% ITC and adds backup power plus TOU optimization benefits.
What if I’m renting or can’t install rooftop solar? Portable solar setups are a great entry point. The Jackery Explorer 1000 Plus paired with a Jackery SolarSaga 200W panel lets you generate and store solar energy on a balcony or patio. The EcoFlow DELTA 2 Max with an EcoFlow 400W panel is a higher-capacity option. These systems won’t offset your entire electric bill, but they can power essentials during outages and reduce grid dependence by 15-25% for a fraction of the cost of a rooftop installation. The Anker SOLIX C1000 and Renogy 200W panel is another excellent portable combo at a lower price point.
How does solar affect my home value? Studies by Zillow and Lawrence Berkeley National Lab show that solar adds 3-4% to home value, or roughly $15,000-$20,000 for the average home. The premium is higher in states with high electricity costs and active solar markets. Owned solar systems (cash or loan) add full value. Leased systems add little to no value and can complicate sales. In most states, the added value is exempt from property tax increases.